The conventional narrative about foundation investment performance goes something like this: larger endowments outperform because they have more sophisticated investment committees, longer time horizons, and greater risk tolerance. Smaller foundations, the thinking goes, underperform because they're too conservative, too focused on liquidity, or simply make worse decisions.
That narrative is incomplete at best. It misses the structural reality that shapes foundation investing: access.
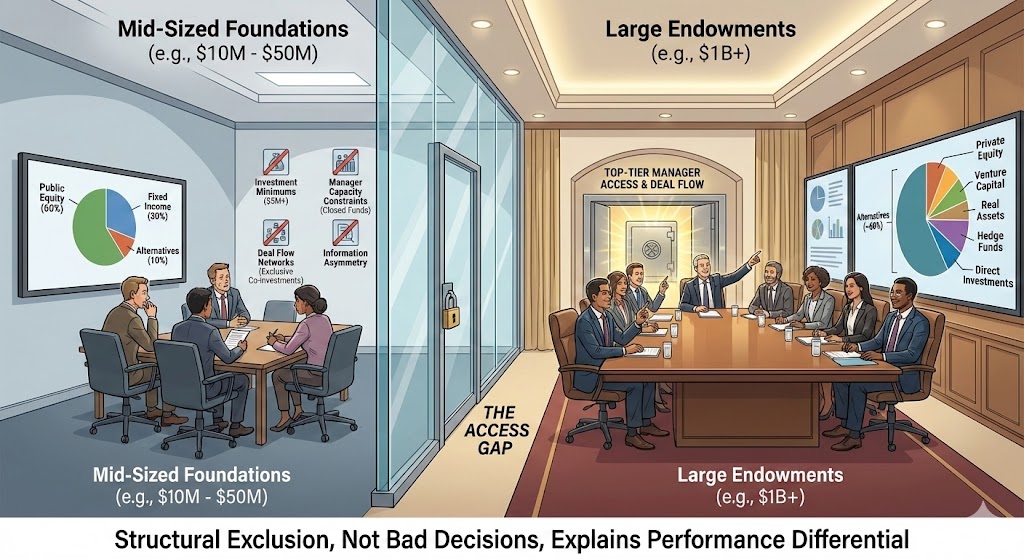
The real gap between a $10 million foundation and a $1.5 billion endowment isn't about risk appetite or investment acumen. It's about which doors are open, which managers will take your call, and which opportunities you even know exist. While this analysis focuses on sub-$50M foundations, the dynamics it describes are well understood by larger institutions—and increasingly relevant to them as access, capacity, and manager concentration risks evolve.
The Data: How Asset Allocation Diverges by Size
The evidence for the access gap is hiding in plain sight. Every year, the NACUBO-Commonfund Study of Endowments documents how different-sized institutions actually invest—and the divergence is stark.
Here's what the allocation gap actually looks like:
| Endowment Size | Public Equity | Fixed Income | Alternatives | 10-Year Return |
|---|---|---|---|---|
| Over $1B | ~20% | ~6% | ~60% | 8.4% - 9.0% |
| $500M - $1B | ~28% | ~10% | ~45% | 7.5% - 8.0% |
| $100M - $500M | ~35% | ~12% | ~35% | 7.0% - 7.5% |
| Under $100M | ~45% | ~15% | ~20% | 6.5% - 7.0% |
Note: Allocation percentages represent approximate ranges compiled from multiple industry sources including NACUBO-Commonfund and Foundation Source studies. Exact allocations vary by institution.
The pattern is unmistakable: as endowment size increases, alternatives allocation increases, and returns follow. But this isn't because smaller foundations are making worse decisions. It's because they can't make the same decisions at all.
The Four Barriers to Access
1. Investment Minimums
Top-tier private equity and venture capital funds typically set minimums at $5 million or higher. For a $10 million foundation, a single fund commitment of that size would represent 50% of assets—an obvious non-starter from a diversification standpoint. Even at $25 million, a $5 million commitment is 20% of the portfolio, leaving room for only 4-5 fund relationships total.
Compare this to a $500 million endowment, where a $5 million commitment is 1% of assets. They can build a diversified alternatives portfolio of 20-30 funds while maintaining appropriate position sizing. The math simply works differently.
2. Manager Capacity Constraints
The best-performing managers close to new investors. Not sometimes. Routinely. When top-quartile managers raise a new fund, they're typically oversubscribed before they even officially launch fundraising. Access goes to existing LPs, strategic relationships, and institutions that can commit $25-50 million or more.
Mid-sized foundations aren't competing in a vacuum—they're competing against institutions that have built LP relationships over decades.
3. Deal Flow Networks
Co-investment opportunities—direct investments alongside fund managers that can significantly reduce fee drag—flow through relationships. If you're not an LP in the fund, you're not getting the co-investment call. If you haven't built the network, you're not hearing about the secondary transaction that just became available at a 15% discount to NAV.
The Mercer survey found that larger organizations are significantly more likely to use co-investments and secondaries, which help mitigate the J-curve, potentially enhance diversification, and may provide greater portfolio control. These aren't exotic strategies—they're standard practice at scale. But they require access to deal flow that simply doesn't reach smaller institutions.
4. Information Asymmetry
Even when a mid-sized foundation can meet a fund's minimum, they're often evaluating managers with limited information compared to what larger institutions receive. The detailed performance attribution, portfolio company updates, and strategic insights that flow to a fund's largest LPs don't always make it to smaller check writers.
The result? Mid-sized foundations are making allocation decisions with less information, less manager access, and fewer options than their larger peers.
Why the 60/40 Debate Misses the Point
Much of the discourse around foundation investing centers on whether traditional 60/40 portfolios are still viable, whether alternatives add value, and what the "right" allocation should be. These debates assume that allocation is purely a decision—a choice between available options.
But for many mid-sized foundations, allocation isn't just a decision. It's constrained by access.
"Should we allocate 30% to alternatives?" is a very different question from "Can we allocate 30% to alternatives with managers we'd actually want to own?"
A foundation with $10 million in assets and a desire to allocate 30% to alternatives ($3 million) faces immediate problems:
- With $5 million minimums, they can access one fund. One.
- With $2 million minimums, they can access two or three funds—but those lower minimums often correlate with emerging managers or lower-tier firms.
- To build a truly diversified alternatives portfolio (vintage year diversification, strategy diversification, manager diversification), they'd need to allocate 50-60% of assets to alternatives just to meet enough minimums—creating new concentration risks.
The result: the allocation that might be optimal is inaccessible, and the allocation that's accessible isn't optimal.
Why This Is a Governance Issue, Not Just an Investment Issue

Here's what makes the access gap hard to see in standard investment committee discussions.
When a foundation's investment committee reviews their portfolio and performance, they see:
- Their actual returns (say, 7.0% over 10 years)
- Their asset allocation (say, 60% equity, 25% fixed income, 15% alternatives)
- Peer comparisons showing larger endowments outperforming
What they don't see—what's never in the materials:
- The opportunity set they couldn't access
- The managers who wouldn't take their call
- The funds that were closed before they even knew to ask
The Question Boards Should Be Asking
"What is our actual investable universe, and how does it compare to what a $500 million endowment can access?"
That's the question that reframes the conversation. Not "Are we making good decisions?" but "Are we operating with the same opportunity set we're being compared against?"
For larger institutions, the governance question often becomes: how concentrated is our access, and what happens if key manager relationships change?
The answer, for most mid-sized foundations, is no. And that matters because boards are often evaluating performance against benchmarks and peers without recognizing that they're playing a different game entirely.
Manager Selection and the Performance Dispersion Problem
In public equity markets, the difference between a top-quartile manager and a bottom-quartile manager is relatively modest—perhaps 1.5 percentage points annually. Manager selection matters, but not dramatically. Index funds exist precisely because manager selection in public markets doesn't reliably add value net of fees.
Private markets are completely different.
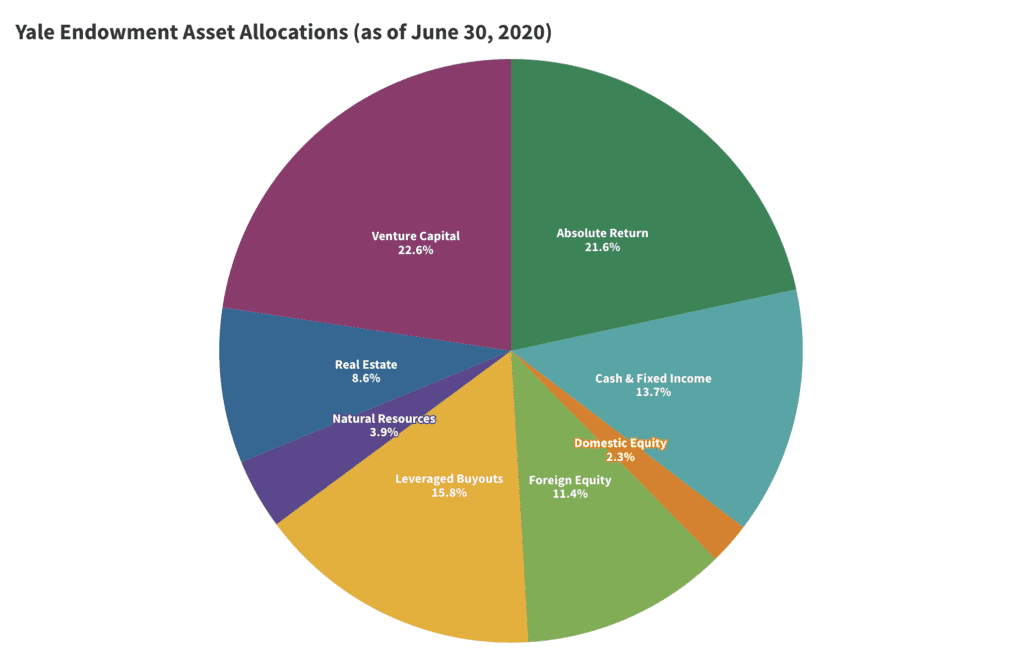
Manager selection in private markets isn't just important—it's the dominant factor in returns. Studies of Yale's endowment, for example, have found that approximately 60% of their alpha came from manager selection, not asset allocation.
Now layer the access problem on top. If the best managers are systematically closed to mid-sized foundations, and manager selection drives returns in private markets, access limitations don't just create a modest performance drag—they create a structural disadvantage that compounds over time.
A foundation that can only access second or third-tier managers isn't just getting slightly worse returns. In private markets, they may be getting dramatically worse returns while taking the same or greater risk.
The Budget Capacity Connection
Better investment returns translate directly into budget capacity—the ability to fund programs, invest in staff, build infrastructure, and pursue long-term initiatives without constantly choosing between mission and sustainability.
A 200 basis point annual return differential on a $10 million foundation is $200,000 per year. Over a decade, accounting for compounding, that's millions in foregone program funding or organizational investment.
For more on how investment returns connect to organizational capacity and staff compensation, see our article on The Hidden Cost of Underpaying Nonprofit Staff.
What Boards Can Actually Do
So what's the path forward? The access gap is real, but it's not insurmountable. Here are the practical steps foundations can take:
1. Audit Your Actual Opportunity Set
Don't just review your current portfolio—review what you're not seeing. Ask your advisor or consultant:
- What managers or strategies are closed to us because of our size?
- What would our alternatives allocation look like if we had a $500 million portfolio?
- Are we accessing institutional-quality managers, or settling for what's available?
2. Explore Aggregation Strategies
Some platforms and advisors pool smaller foundations to meet manager minimums while maintaining separate accounts. Done properly, this can open access to institutional-quality managers without the fee stacking that makes funds-of-funds unattractive.
The key questions:
- Are you getting true institutional access, or just repackaged retail products?
- What's the all-in fee load once you add platform fees to underlying fund fees?
- Do you maintain appropriate governance and transparency?
3. Understand Your Advisor's Network Depth
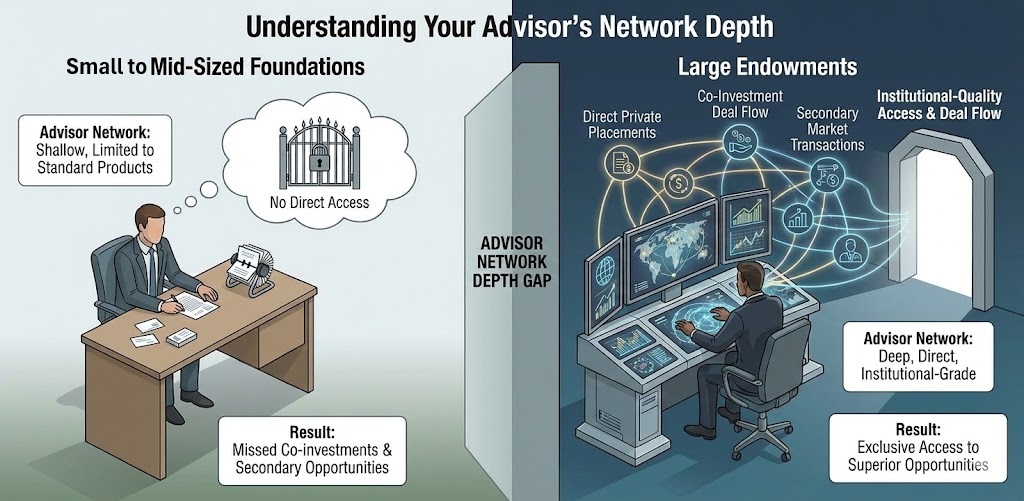
Not all advisory relationships provide the same level of access. Boards should understand whether their advisor can deliver:
- Direct access to institutional-quality private placement opportunities
- Co-investment deal flow sourced through capital markets relationships, not just fund access
- Secondary market transactions that provide immediate exposure without J-curve drag
The question isn't what model your advisor uses—it's whether the model delivers access your foundation couldn't otherwise obtain.
4. Reframe Board Conversations
Investment committees should stop debating "What's our allocation?" and start asking "What's our access?"
Add a standing agenda item: Opportunity Set Review
Annually, have your advisor present:
- Managers you attempted to access but couldn't
- Strategies that are available at scale but not at your size
- Performance comparison: your portfolio vs. what an unconstrained portfolio could have achieved
This changes what investment committees discuss—from performance criticism to structural recognition.
5. Accept Trade-Offs Consciously
Sometimes the honest answer is: "We can't build the portfolio we want at our current size, so we need to optimize within our constraints."
That might mean:
- A higher allocation to public markets than "optimal" because the alternatives we can access aren't worth the illiquidity premium
- Concentrated positions in a small number of high-conviction alternatives managers rather than faux-diversification across mediocre options
- Accepting that your 10-year returns will lag mega-endowments not because you're doing anything wrong, but because you're operating in a different universe
A well-constructed public markets portfolio with honest expectations may outperform a poorly-accessible alternatives program that's more about checking boxes than actually accessing alpha.
Conclusion: Acknowledging Reality to Change It
The gap between large and mid-sized foundations isn't destiny—but it is structural. Closing the gap requires first acknowledging it exists.
Most foundation boards and investment committees are having the wrong conversations. They're debating allocations as if all allocations are equally accessible, evaluating returns as if all institutions compete on a level playing field, and making decisions as if access is infinite.
It's not.
The foundations that will outperform their peers aren't necessarily the ones with the most sophisticated allocation models. They're the ones asking better questions:
- What opportunity set are we actually operating inside?
- How does our access compare to the benchmarks we're measured against?
- Are we optimizing within our constraints, or pretending constraints don't exist?
- What would it take to expand our opportunity set?
Access isn't everything. But pretending it doesn't matter is how foundations fall behind.
Sources & References
- NACUBO-Commonfund Study of Endowments, 2024. Institutional Fund Asset Allocation and Performance.
- Mercer, 2025. Endowment and Foundation Private Markets Study.
- Foundation Source, 2023. Foundation Investment Benchmark Study.
- Cambridge Associates, 2024. Private Equity and Venture Capital Performance Dispersion Analysis.
- Swensen, David F. Pioneering Portfolio Management: An Unconventional Approach to Institutional Investment. Free Press, 2009.
- Yale Investments Office. The Yale Endowment Annual Report. Various years.
Important Disclosures:
This article is provided for informational purposes only and does not constitute investment advice, an offer to sell, or a solicitation of an offer to buy any securities. All investments involve risk, including the potential loss of principal. Past performance is not indicative of future results. Private equity and alternative investments involve significant risks including illiquidity, loss of capital, and lack of transparency. Not all investors will qualify for or benefit from alternative investment strategies. Together Forward Capital is an SEC-registered investment adviser operating as a DBA of R.F. Lafferty & Co., Inc., member FINRA/SIPC. Registration does not imply a certain level of skill or training.
© 2026 Together Forward Capital. All rights reserved.
Securities and advisory services offered through Together Forward Capital, a DBA of R.F. Lafferty & Co., Inc., member FINRA/SIPC, a broker-dealer and a Securities and Exchange Commission Registered Investment Adviser.